k-Nearest Neighbors#
k-Nearest Neighbors is a nonparametric model. The idea is simple:
choose hyperparameter \(k\in\mathbb N\);
choose a distance metric in \(\mathbb R^d\) (for example, Euclidean);
for a sample \(\boldsymbol x \in \mathbb R^d\) find its \(k\) nearest neighbors among the training dataset;
classify or predict the label of \(\boldsymbol x\) according to the labels of its neighbors.
Distance in \(\mathbb R^d\)#
How to calculate distance \(\rho (\boldsymbol x, \boldsymbol y)\) of vectors \(\boldsymbol x, \boldsymbol y \in\mathbb R^d\)?
Euclidean distance: \(\rho_2(\boldsymbol x, \boldsymbol y) = \sqrt{\sum\limits_{i=1}^d (x_i - y_i)^2}\)
Manhattan distance: \(\rho_1(\boldsymbol x, \boldsymbol y) = \sum\limits_{i=1}^d |x_i - y_i|\)
Minkowski distance: \(\rho_p(\boldsymbol x, \boldsymbol y) = \Big(\sum\limits_{i=1}^d |x_i - y_i|^p \Big)^{\frac 1p}\), \(p \geqslant 1\)
Note
The distance to zero vector \(\rho_p(\boldsymbol x, \boldsymbol 0)\) is called \(p\)-norm:
The unit ball in \(\mathbb R^d\) with respect to \(p\)-norm is defined as
---------------------------------------------------------------------------
ModuleNotFoundError                       Traceback (most recent call last)
Cell In[1], line 2
      1 import numpy as np
----> 2 import plotly.graph_objects as go
      4 from matplotlib import cm
      5 from matplotlib.colors import ListedColormap, LinearSegmentedColormap, to_hex

ModuleNotFoundError: No module named 'plotly'
---------------------------------------------------------------------------
NameError                                 Traceback (most recent call last)
Cell In[2], line 1
----> 1 plot_slider_minkowski([0.67, 0.8, 1, 1.2, 1.4, 1.5,  1.6, 1.8, 2, 2.2, 2.5, 3, 4, 5, 7, 10, "∞"], write_html=True)

NameError: name 'plot_slider_minkowski' is not defined
Q. The “infinite” norm is defined as
What is the value of \(\lim\limits_{p\to +\infty} \Big(\sum\limits_{i=1}^d |x_i|^p \Big)^{\frac 1p}\)?
k-NN algorithm#
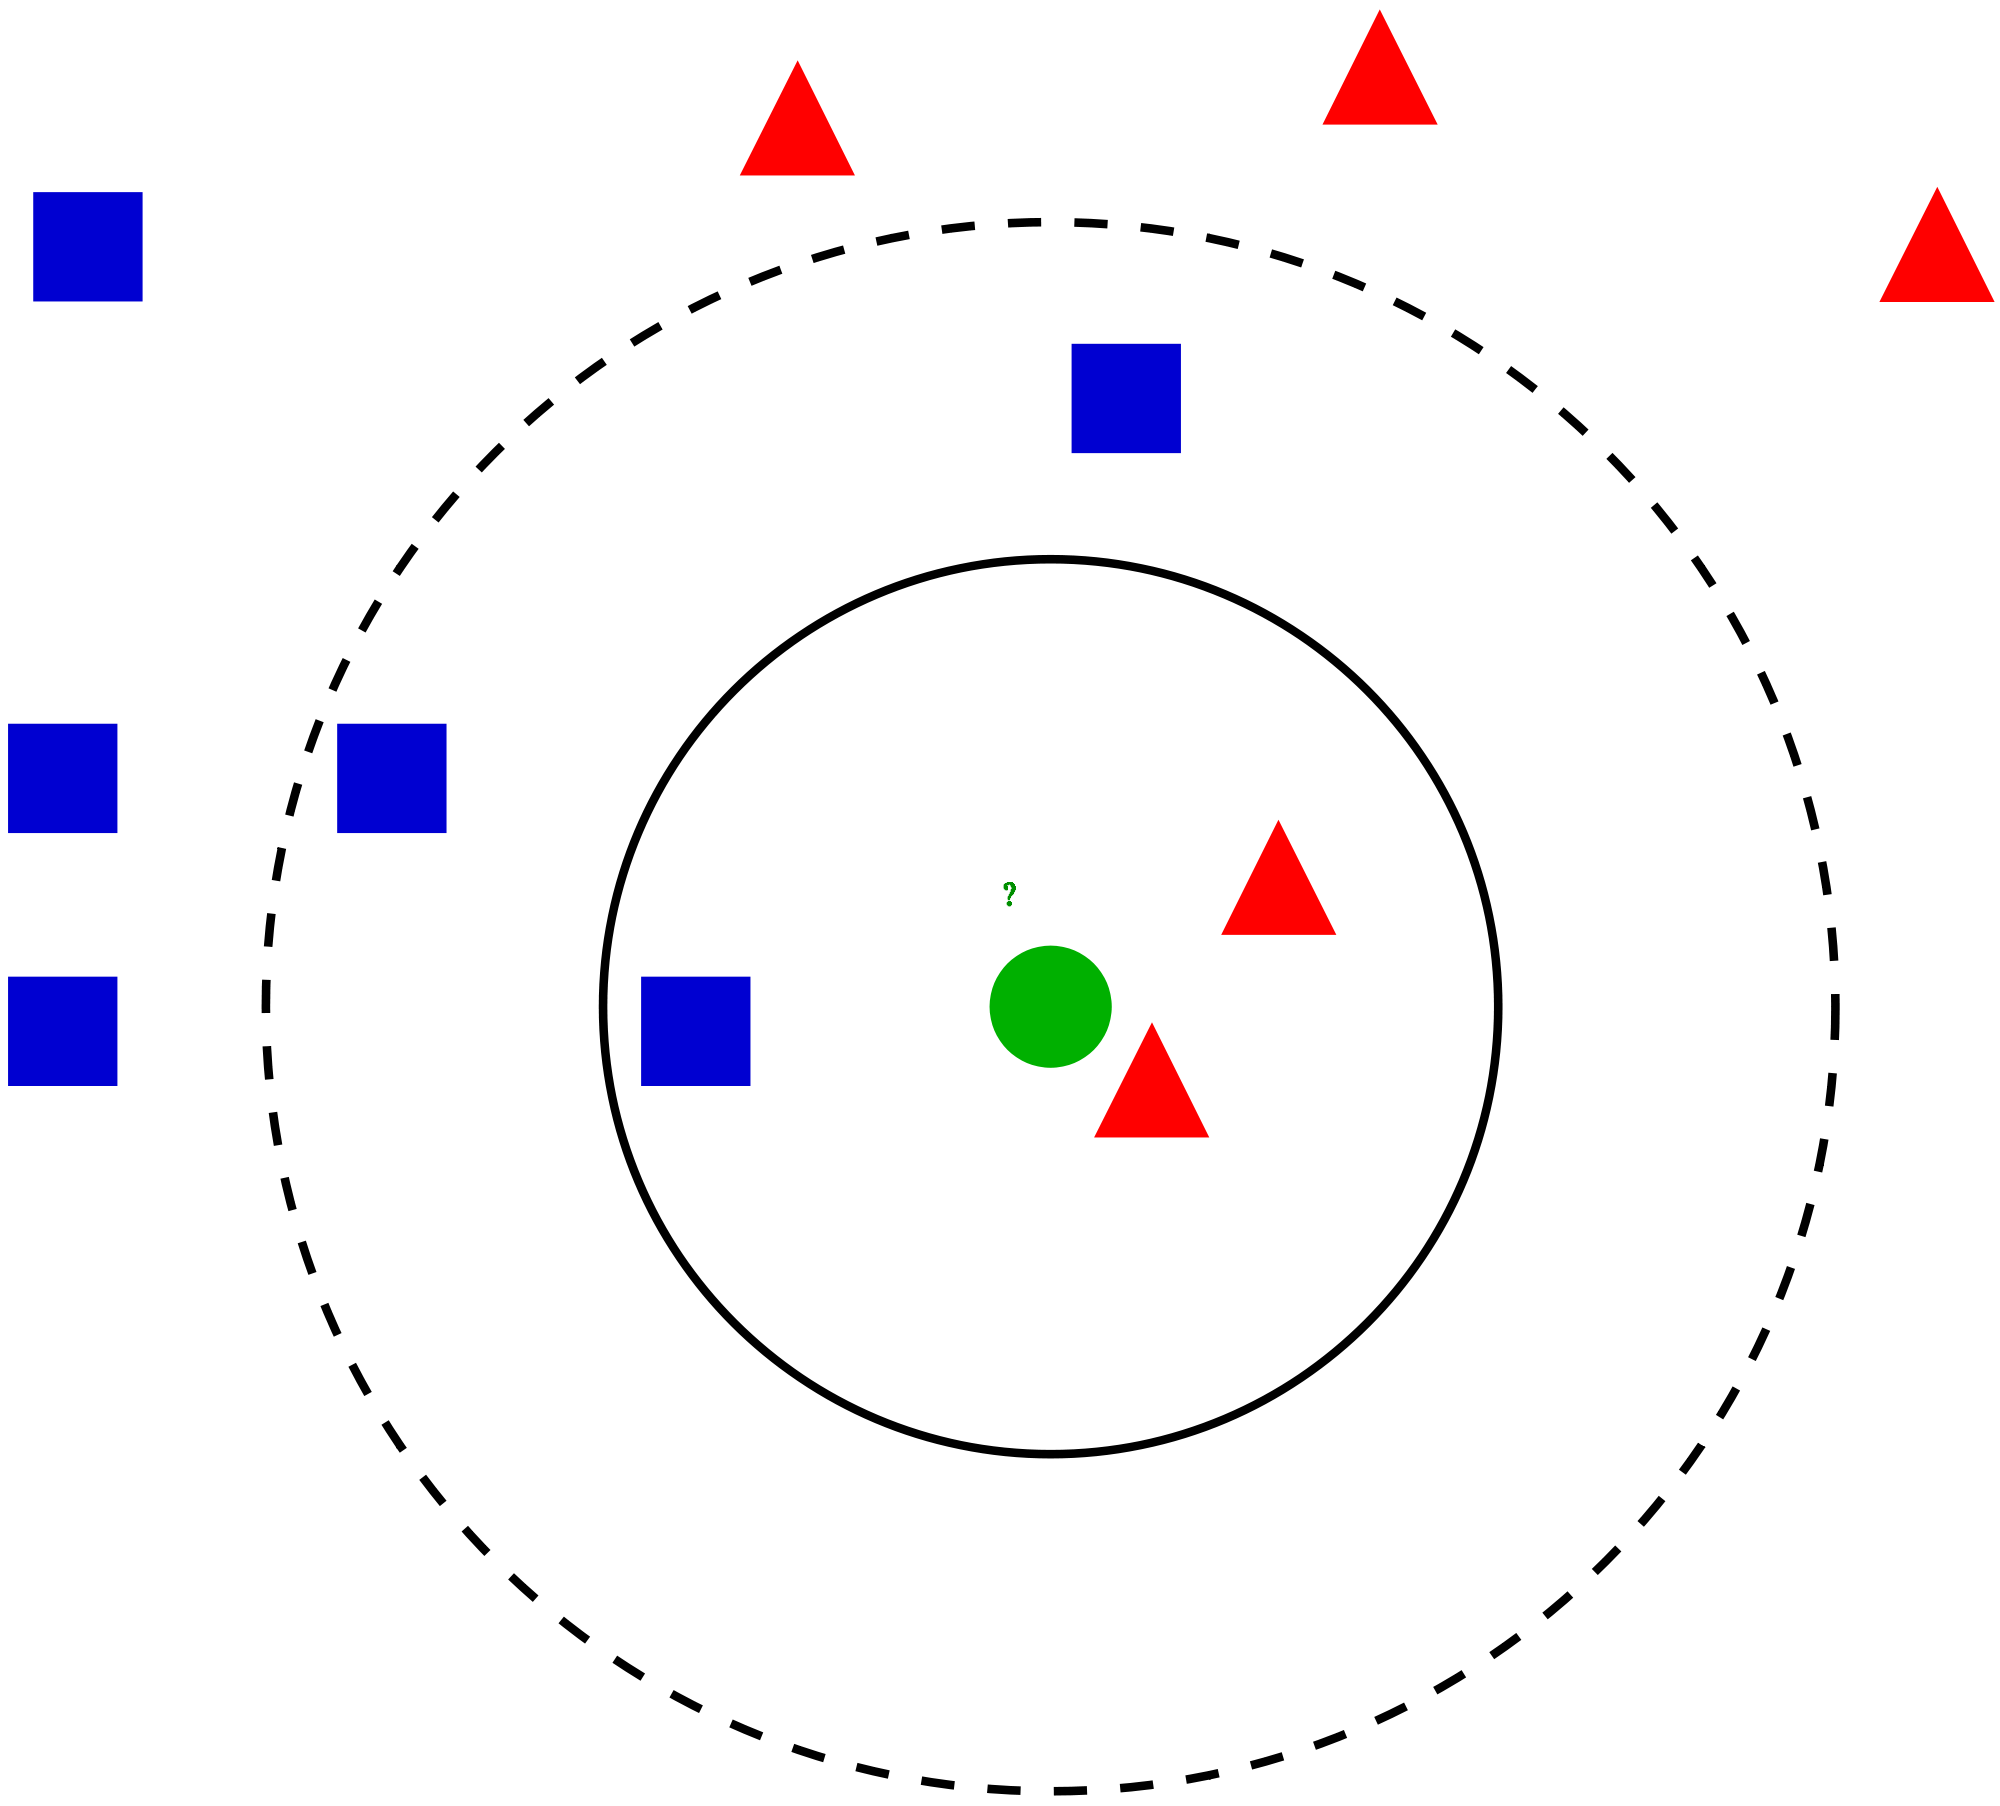
Given the training dataset \(\{(\boldsymbol x_i, y_i)\}_{i=1}^n\), how to classify a new object \(\boldsymbol x\)?
Sort distances \(\rho (\boldsymbol x_i, \boldsymbol x)\) in increasing order:
\[ \rho (\boldsymbol x_{(1)}, \boldsymbol x) \leqslant \rho (\boldsymbol x_{(2)}, \boldsymbol x) \leqslant \ldots \leqslant \rho (\boldsymbol x_{(n)}, \boldsymbol x) \]So \(\boldsymbol x_{(i)}\) is the \(i\)-th neighbor of the object \(\boldsymbol x\)
Let \(y_{(i)}\) be the label of \(\boldsymbol x_{(i)}\)
The label \(\hat y\) of the object \(\boldsymbol x\in\mathbb R^d\) is set to the most common label among \(k\) neighbors of \(\boldsymbol x\):
For regression task the last step is subsituted by
Note that \(\widehat y = y_{(1)}\) if \(k=1\).
Voronoi tessellation#
A k-NN classifier with \(k=1\) induces a Voronoi tessellation of the points. This is a partition of space which associates a region \(V(\boldsymbol x_i)\) with each sample \(\boldsymbol x_i\) in such a way that all points in \(V(\boldsymbol x_i)\) are closer to \(\boldsymbol x_i\) than to any other point. In other words,

Role of \(k\)#
The decision boundaries become smoother as \(k\) grows. Here is an example from [Murphy, 2022] (figure 16.2): k-NN algorithm is applied to simulated data with three clusters.
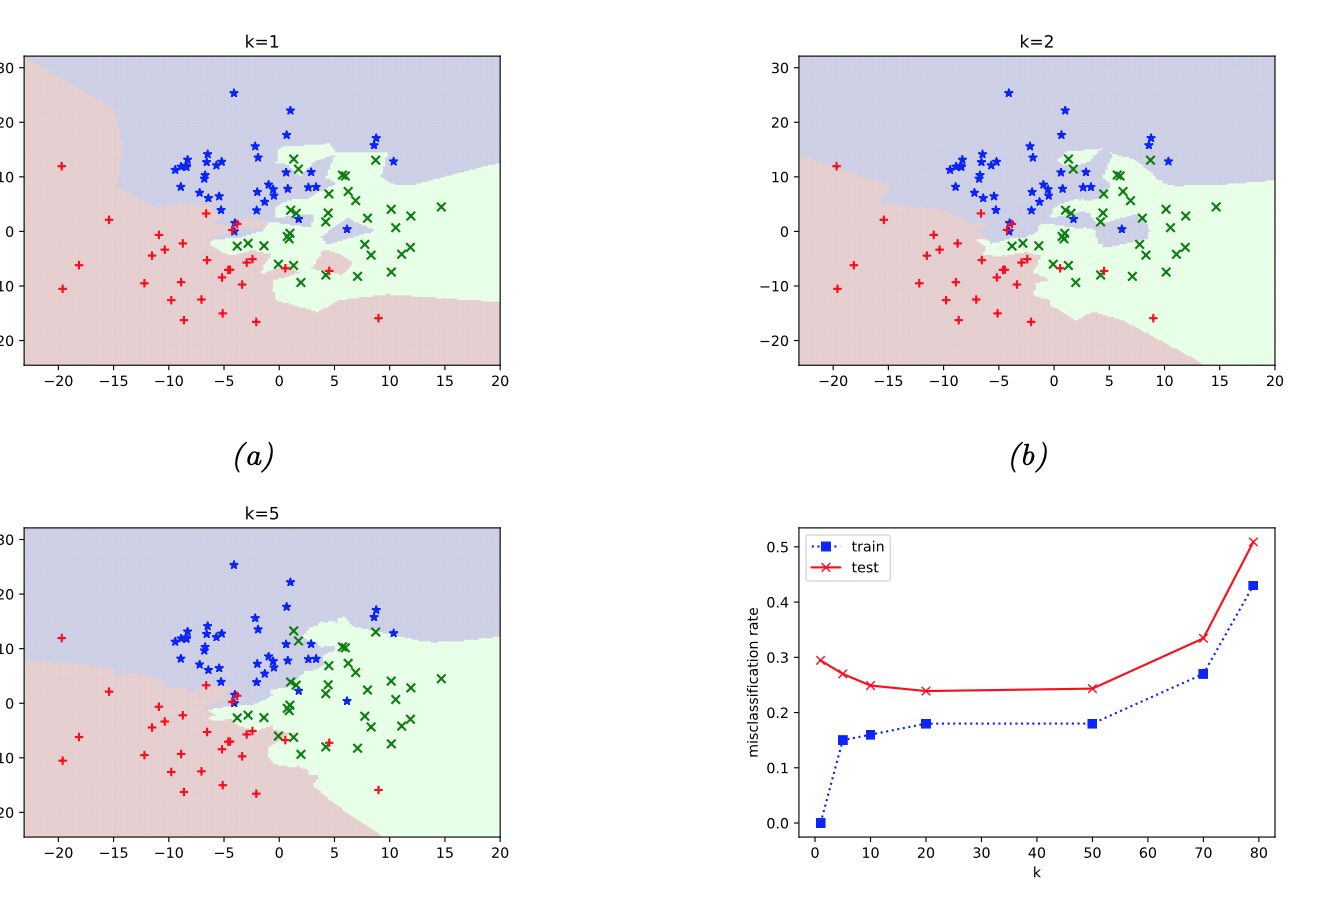
Q. Look at the graph of train and test errors. For which values of \(k\) we can suspect overfitting?
Effective number of parameters of \(k\)-NN
It is equal to \(\frac n k\). To get an idea of why, note that if the neighborhoods were nonoverlapping, there would be \(\frac nk\) neighborhoods and we would fit one parameter (a mean) in each neighborhood ([Hastie et al., 2009], p. 14)
Curse of dimensionality#

Only red part of watermelon is useful, and watermelon rind is thrown away. Suppose that the watermelon is a ball of radius \(R\), and the length of the rind is \(10\%\) of \(R\).
This is how the curse of dimensionality works. In \(50\)-dimensional space there is almost nothing to eat in a watermelon.

What are the consequenes of curse of the dimensionality for \(k\)-NN?
A common example from textbooks
Suppose we apply a \(k\)-NN classifier to data where the inputs are uniformly distributed in the \(d\)-dimensional unit cube. Suppose we estimate the density of class labels around a test point \(\boldsymbol x\) by “growing” a hyper-cube around \(\boldsymbol x\) until it contains a desired fraction \(p\) of the data points. The expected edge length of this cube will be \(e_d(p)=p^{\frac 1d}\) (see [Murphy, 2022], p. 530-531). For example, if \(d=10\) and we want to capture \(1\%\) of neighbours, we need extend the cube \(e_{10}(0.01) \approx 0.63\) along each dimension around \(\boldsymbol x\).

TODO
Make the last plot interactive
Apply k-NN to some real datasets
Add a plot and quiz on manual calculations with nearest neighbors